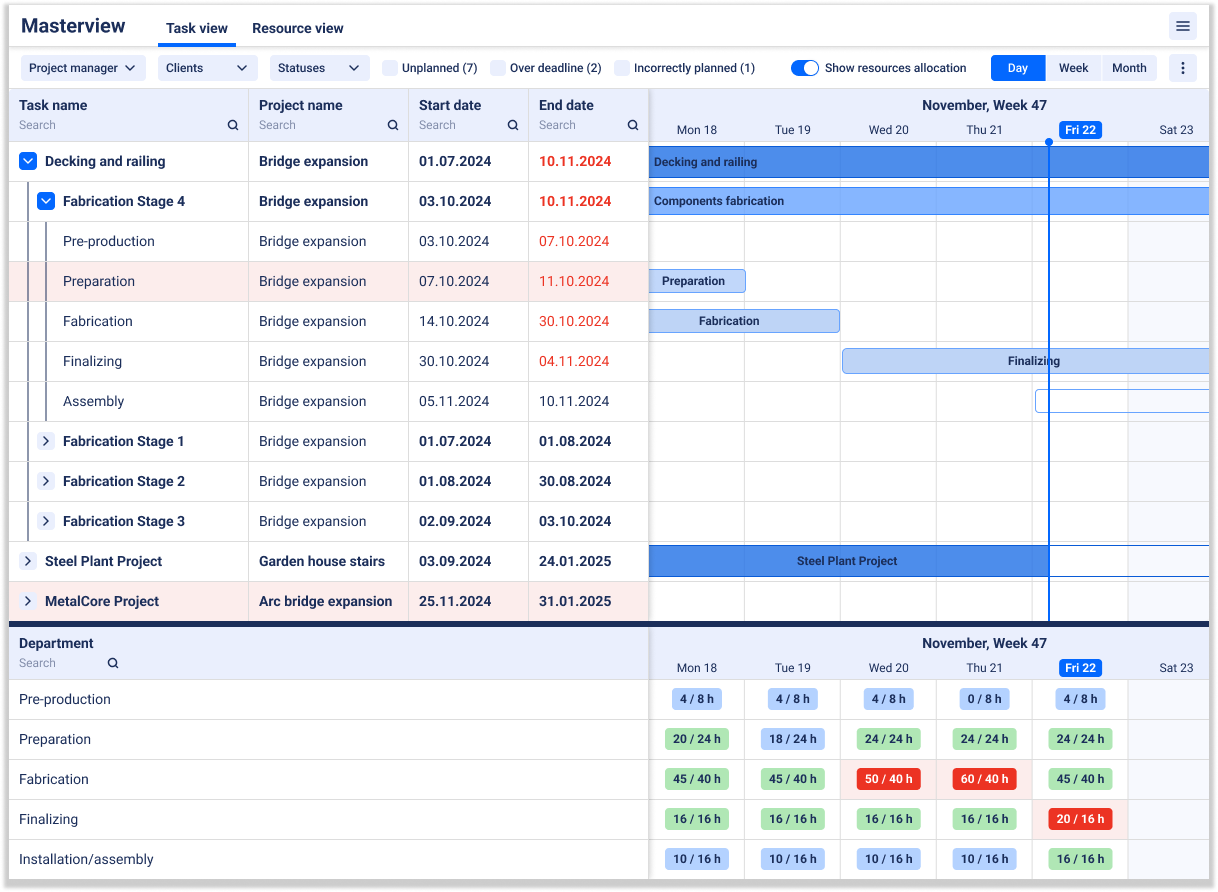
A Gantt Chart is a visual project scheduling tool, represented by a horizontal bar timeline that illustrates each task’s start and finish dates.
In a steel fabrication setting, a Gantt chart can map out the schedule of a project (or all projects), showing, for example, that Cutting will happen on Monday, Welding by Wednesday, and Inspection by Friday for a given job.
It offers a high-level overview of the job shop schedule, making it easy to see task sequences, overlaps, and deadlines at a glance.
Gantt charts are especially useful for small fabrication shops to communicate the plan to the team. It allows each department to see what needs to be done when, and management to monitor progress versus the plan (if a bar extends beyond today’s date, the task is late).