Most small and mid-size steel shops know exactly how stressed everyone feels, but only vaguely how well the business is performing.
You hear things like:
- “We’re always busy.”
- “We somehow get it done.”
- “Overtime is brutal, but what can you do?”
That is not a definition of winning. That is survival.
The best performing, larger steel fabricators run on a simple scoreboard that tells them, week by week, if they are actually getting better: faster, more reliable and more profitable, without squeezing people harder.
The good news: you do not need an ERP monster or a 10-person planning team to start optimizing your metal fabrication performance. A <50 person custom steel shop can get most of the benefit from about six KPIs, tracked consistently.
This article walks through those six numbers to focus on, why they matter for metal fabrication performance, and how to start using them in a small or medium steel shop.
Why a simple scoreboard beats gut feel
Research on performance measurement systems in manufacturing SMEs keeps finding the same pattern: companies that regularly track a focused set of KPIs make better decisions and achieve stronger operational and financial results than those flying blind.
When shops implement structured KPIs around on-time delivery (OTD), lead time and quality, and then use them to drive improvement projects, case studies report double-digit gains in on-time delivery, productivity and throughput:
- A small make-to-order (MTO) steel fabricator in Peru increased its on-time delivery from 35% to 80% after introducing a lean production model and metal fabrication performance tracking.
- Another metalworking company improved its on-time delivery from 66% to 88%, while also cutting setup times and cycle times, after implementing a lean model with clear KPIs.
- EZIIL customers see their on-time delivery and team productivity increase significantly within a year after transitioning to EZIIL thanks to having better shop floor visibility, working from one centralized software, built specifically for steel fabricators, and metal fabrication performance tracking.
For your team, the impact is very practical:
- You stop arguing about how “busy” you are and start talking about outcomes.
- You can push back on unrealistic promises with facts.
- You protect your crew from endless overtime by showing exactly what current capacity can handle.
You are not turning people into numbers. You are using numbers to protect your people and your margins.
The 6 KPIs that drive metal fabrication performance
There are hundreds of things you could measure. That is how people end up with dashboards nobody opens.
For a small/medium custom steel shop, these six KPIs will give you 80% of the insight you need:
- On-time delivery (OTD) rate
- Average lead time by project type
- Hours per ton/per assembly
- Rework/non-conformance rate
- Overtime hours per month
- Euro/dollar days (money-weighted delay)
Let’s go through them one by one.

1) On-time delivery (OTD) rate – your promise score
On-time-delivery (OTD) rate is the clearest customer-facing measure of your metal fabrication performance. It tells you whether customers experience you as a reliable partner or as “that shop that always cuts it close.”
Definition
On-time delivery (%) = (Number of jobs delivered on or before the promised date ÷ total jobs delivered in the period) × 100
You should track this weekly and round it up monthly.
When it comes to OTD, you are not trying to hit 100% overnight, but if you are sitting at 60-70%, setting a target of 85-90% over the next 6-12 months is realistic once you start controlling WIP, improving planning and removing common blockers.
Why should you care about OTD rate
- Fewer “where is my job?” calls.
- Less last-minute panic and firefighting.
- Easier planning because promises match reality.
2) Average lead time by project type – how long work really takes
Lead time is how long your customer waits from “yes” to “we’re done.” It is one of the strongest drivers of customer satisfaction and competitiveness in make-to-order manufacturing.
Definition
For each category of work (stairs, platforms, railings, frames, mezzanines), define:
Lead time (days) = Ship/install date − order confirmation/PO/contract date
Then track the average lead time for the last X jobs of each type (for example, last 10 stair jobs, last 5 frame jobs).
Segmenting by project type is key. A 2-ton stair and a 40-ton frame will never behave the same.
Why you should care about lead time
- Sales and estimating can promise realistic dates without “hoping” the shop will magically cope.
- You can see whether changes you make (reducing WIP, changing sequence, adding fixtures) actually shorten delivery times.
- When a customer asks for a tighter schedule, you can respond with real data: “Our typical lead time for jobs like this is 8 weeks. To do it in 6, we would need X or Y.”
In improvement projects, lead time often drops alongside OTD gains.
3) Hours per ton/assembly – how productive your crew really is
Hours per ton/assembly is your productivity lens: how many labor hours it takes your team to produce a ton of steel or a complete assembly.
It is a classic benchmark in steel fabrication and is widely used in industry surveys and research as a fabrication-phase productivity indicator.
Definition
For a period (for example, a month or a project):
Hours per ton = total direct labor hours logged to that work ÷ total fabricated tons
If tonnage is not practical (lots of small, custom assemblies), use:
Hours per assembly = total direct labor hours ÷ number of assemblies produced
Why your should care about hours per ton/assembly
- Shows whether you are getting more out of the same crew over time.
- Exposes jobs that “ate” far more hours than estimated.
- Makes improvement tangible: “If we save 2 hours per ton, that frees X hours per month without hiring anyone.”
Example: a steel shop doing 1000 tons a year. Saving two hours per ton “creates” 2000 extra hours a year. That is a huge buffer against overtime and rushed hiring.
4) Rework/non-conformance rate (NCR) – your quality tax
Rework and non-conformances are the hidden tax on your metal fabrication performance. Every weld that fails inspection or part that does not fit on site means extra hours, extra material and often extra overtime.
Buyers and general contractors watch this closely. High NCR rates mean stoppages, returns and re-fabrication.
Definition
Keep it simple to start:
Rework/NCR rate (%) = (Number of jobs with rework or non-conformance in the period ÷ total jobs in the period) × 100
Optionally also track:
- Rework hours as a % of total hours
- NCRs per X tons or per X assemblies
Why you should care about rework rate/NCR
- Rework almost always happens under time pressure, exactly when stress is highest.
- Reducing rework frees capacity without hiring or buying machines.
- Fewer mistakes means fewer discounts and “goodwill” fixes eating into margin.
Quality metrics like defect rates, customer complaints and first-pass yield are standard KPIs in metal fabrication performance frameworks and are strongly linked to financial outcomes. Tracking rework rate/NCR turns “we’re always fixing stuff” from a vague complaint into a clear number you can shrink.
5) Overtime hours per month – pressure gauge for your people
Overtime is not evil. It is a useful safety valve. But when it becomes the default way to hit due dates, it is a sign that your system relies on heroics, not design.
Definition
Monthly OT hours = sum of all hours above the standard workday/workweek for all employees
You can also look at:
- OT hours as a % of total hours
- OT spikes by project or department
In many lean and scheduling case studies, one of the first visible wins is a reduction in overtime as flow stabilizes and unplanned delays drop.
Why you should care about monthly overtime hours
- Chronic OT is strongly linked to burnout, accidents, turnover and mistakes.
- Reducing OT while keeping or increasing output is a strong proof that your changes are working.
- It lets you tell a clear story internally: “We are not trying to squeeze more out of you. We are redesigning the work so we can hit the numbers without stealing your evenings.”

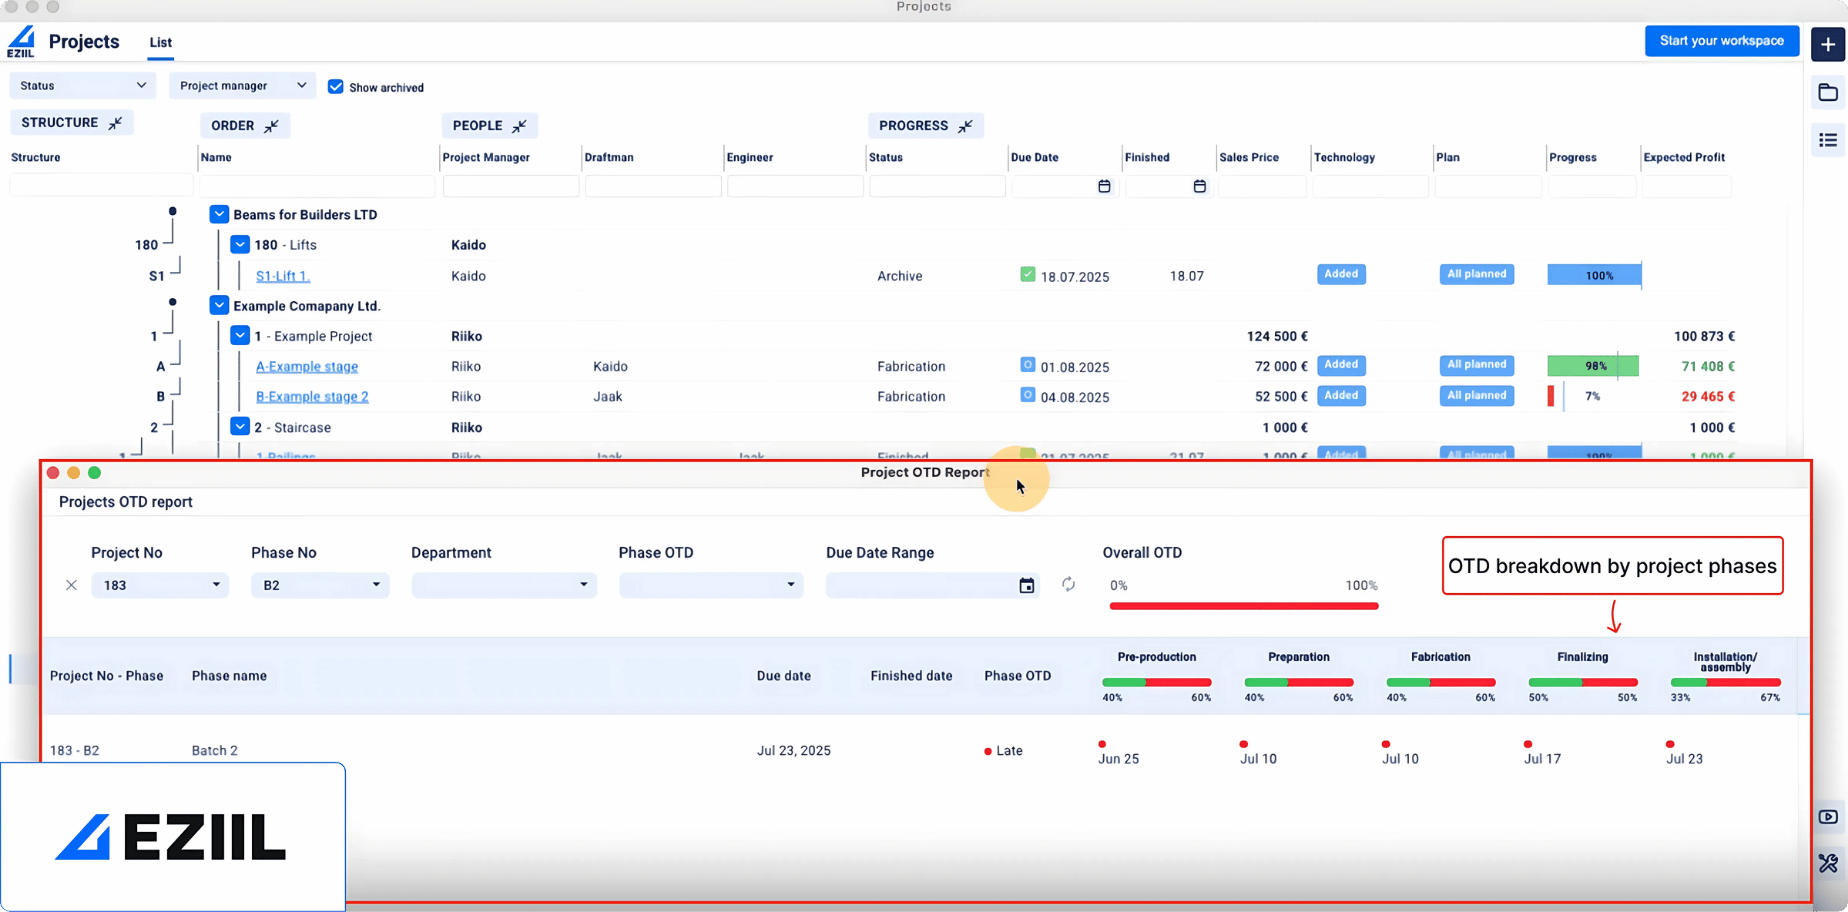
6) Euro/dollar days – when OTD is not enough
This KPI comes from the Theory of Constraints concept of throughput dollar-days: a financial metric that multiplies the value of an order by the time it is delayed.
Definition
Euro/dollar days answer a painful question: “When we are late, how much money are we late with?”
Euro-days of lateness for a job = job value in € (or $) × number of days late (0 if on time or early)
Or:
Total euro-days in a period = sum of euro-days of all jobs that are late or were delivered late in that period
Why OTD can lie to you
Pure OTD can look fine while the business is quietly bleeding:
- 98 small jobs, each worth 2000€/$, delivered on time.
- 2 big projects, each worth 250,000€/$, delivered 3 weeks late.
OTD: 100 out of 100 jobs “on-time or late” gives 98% if those two late jobs are in the period. It looks great.
Euro-days: Each late project: 250,000€/$ × 21 days = 5,250,000 euro/dollar-days.
Total: over 10 million euro/dollar-days of lateness.
Suddenly, the problem is visible. Those two late projects dominate the KPI, as they should.
In our interviews with small and mid-size metal fabricators, many describe euro-days or dollar-days as far more honest than plain OTD, because it reflects the financial impact of late work, not just the count of jobs.
How to use euro/dollar days in a small steel shop
- Calculate the value per job
Use the selling price or estimated revenue for each project. - Record days late
For each job, compare actual ship/install date to promised date. If you ship early or on time, lateness is 0. - Compute euro/dollar days
Multiply value × days late and sum for the week or month. - Sort your late jobs by euro/dollar days
This instantly shows which jobs you should prioritise when everything feels urgent. A 5-day delay on a 200k €/$ project deserves more attention than a 2-day delay on a 5k €/$ stair.
Studies on throughput dollar-days (TDD) and inventory dollar-days (IDD) show that using money-weighted time measures can improve supply chain and production decisions, especially when you are choosing priorities under constraints.
Why you should care about euro/dollar days
- Expose “hidden” big-project risk behind a nice-looking OTD.
- Protect cash flow by focusing scarce capacity on the most valuable at-risk work.
- Align sales, planning and production around which jobs truly matter this week.
How to get started with tracking the right KPIs without overcomplicating it
The easiest and fastest way to start tracking your KPI’s and optimize your metal fabrication performance is with EZIIL Starter. Built specifically for MTO steel fabricators, it’s the all-in-one metal fabrication management software that helps you schedule, plan, execute, track, and analyze production in real time, all in one place.
However, if you’d prefer to do it manually, here is a simple rollout plan.
Step 1: Pick a time window
Take the last 2-3 months of relatively normal work (not the one-off mega project).
Step 2: Collect the bare minimum per job
From your spreadsheets, pull:
- Job ID/name
- Job type (stairs, railings, frames, etc.)
- Order confirmation date
- Promised date
- Ship/install date
- Value (invoice/selling price)
- Tons or assemblies
- Total direct labor hours (even if approximate)
- Whether there was rework/NCR (yes/no)
And from payroll or time tracking:
- Overtime hours per month
Step 3: Calculate the six KPIs
- OTD %
- Average lead time by project type
- Hours per ton/assembly
- Rework/NCR rate and, if possible, rework hours %
- OT hours per month and as % of total hours
- Euro/dollar days for late jobs
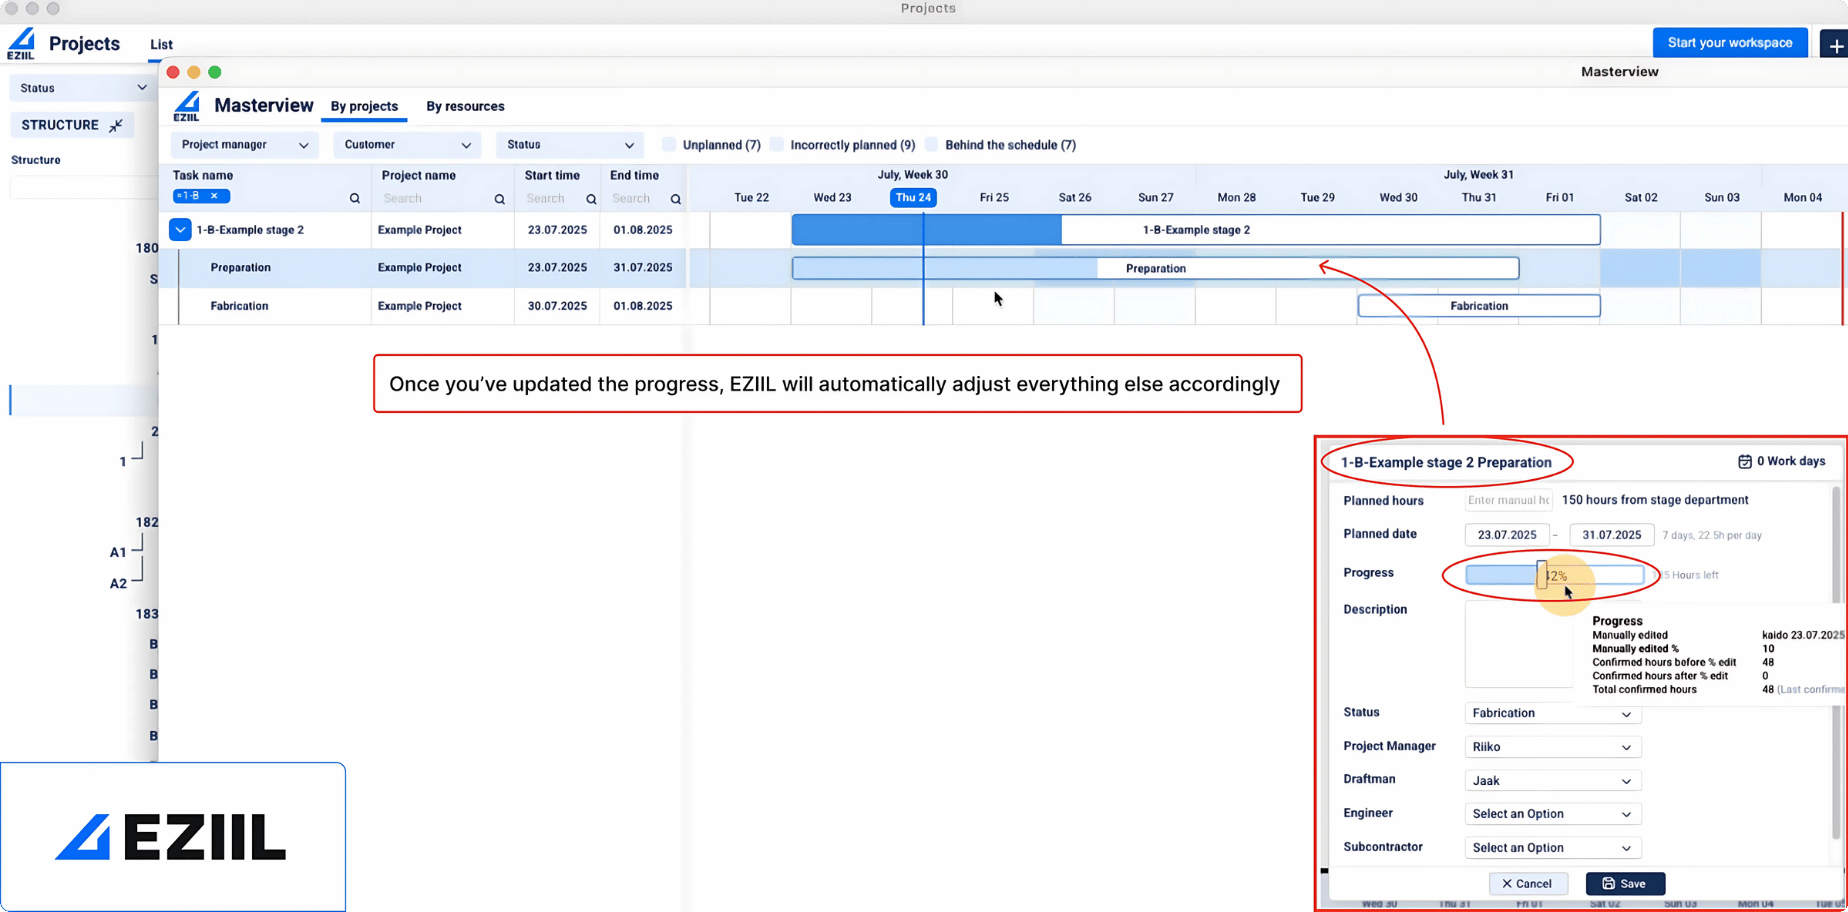
Use a spreadsheet if you are starting from scratch. If you are already using a system like EZIIL, a lot of this is pulled straight into your dashboard and kept up to date automatically. No need to hunt for numbers or calculate anything.
Step 4: Review weekly, not yearly
Once a week, 15–30 minutes with the owner/GM, production lead and planner:
- What got better?
- What got worse?
- What is one thing we will try before next week to move one KPI in the right direction?
That is it. This is metal fabrication performance management at small-shop scale. This is how you drive continuous improvement.